[
clustering
galvanize
kmeans
recommenders
unsupervised-methods
data-science
]
10 Jul 2016
Unsupervised Methods
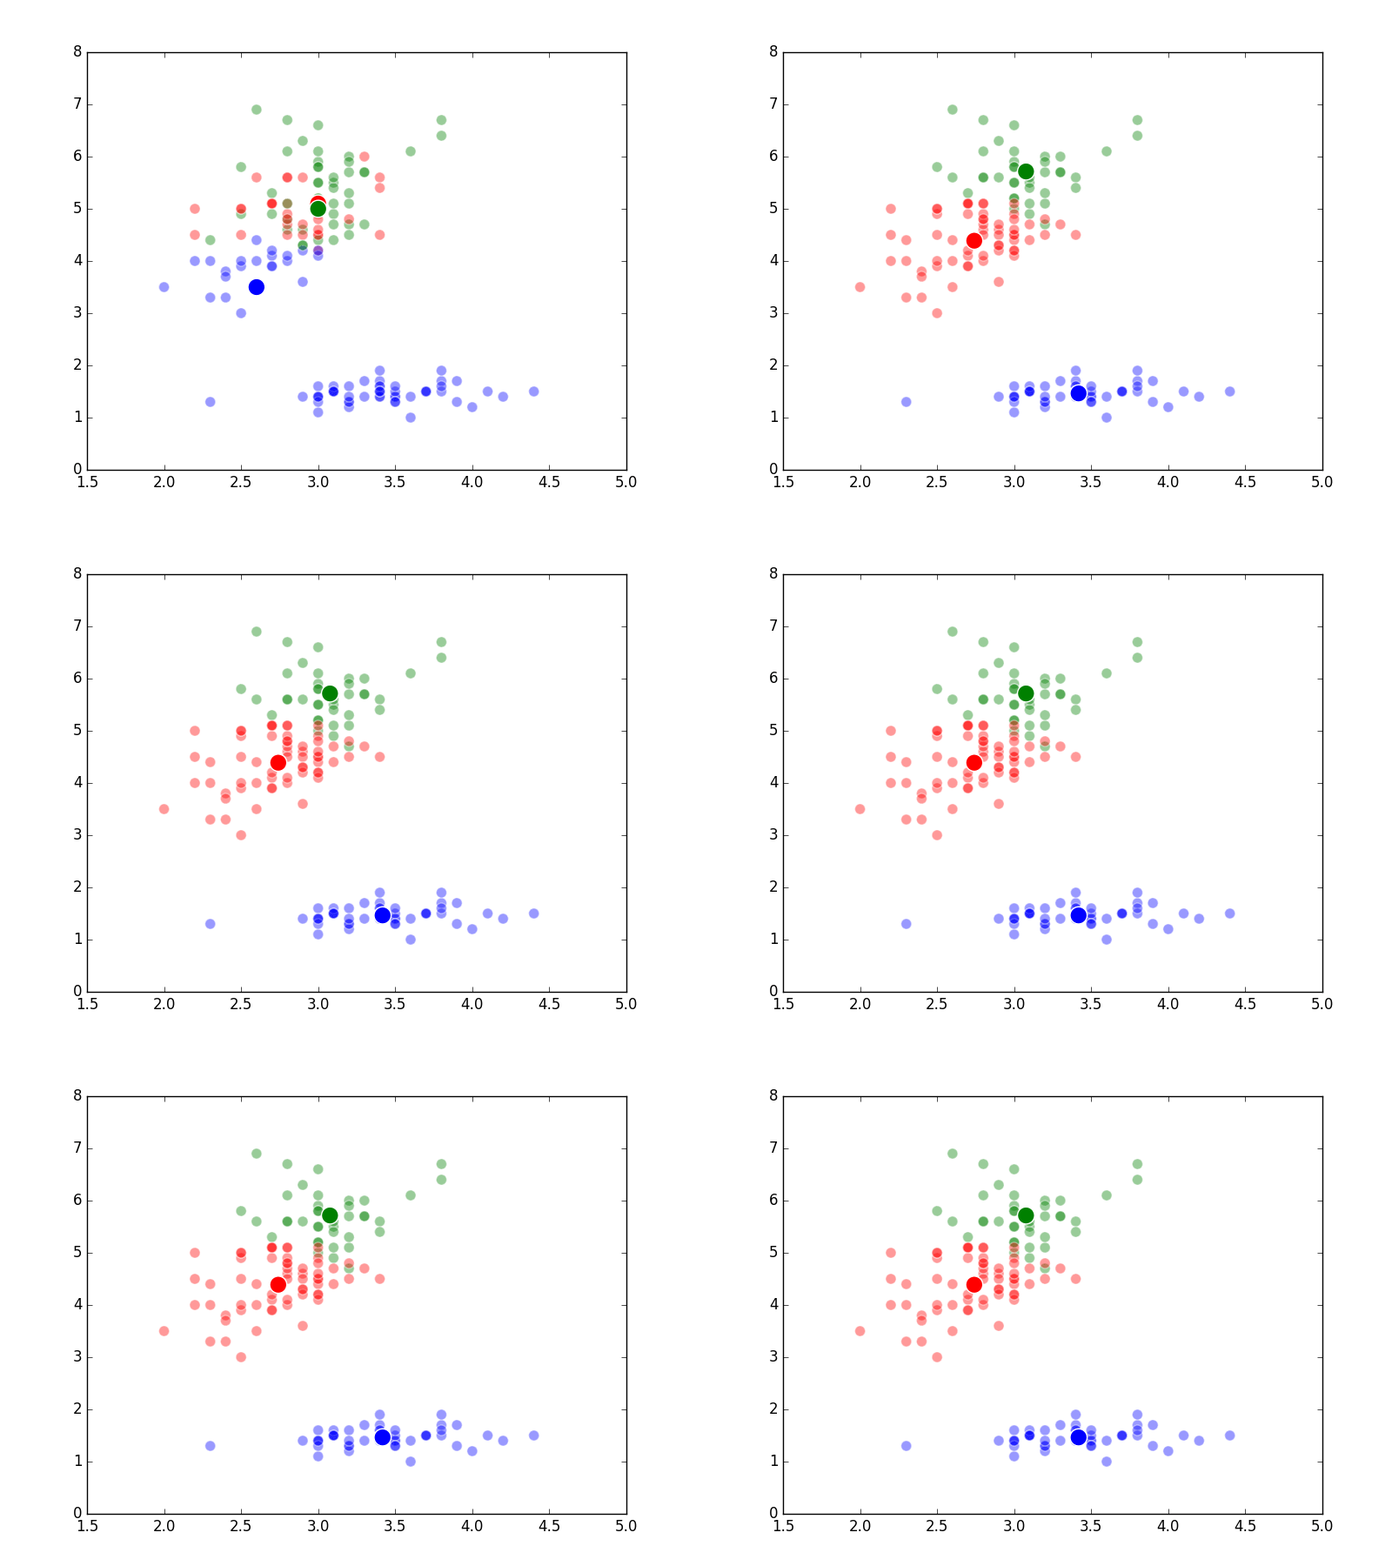
Well, it’s the end of break week, that’s why there wasn’t a post last Sunday. In the beginning of Week 6, we studied what are known as “unsupervised methods”. These methods involve using a computer to discover patterns in data and are often using in clustering or classifying applications. An example of a specific algorithm named “K-means Clustering” is shown above.
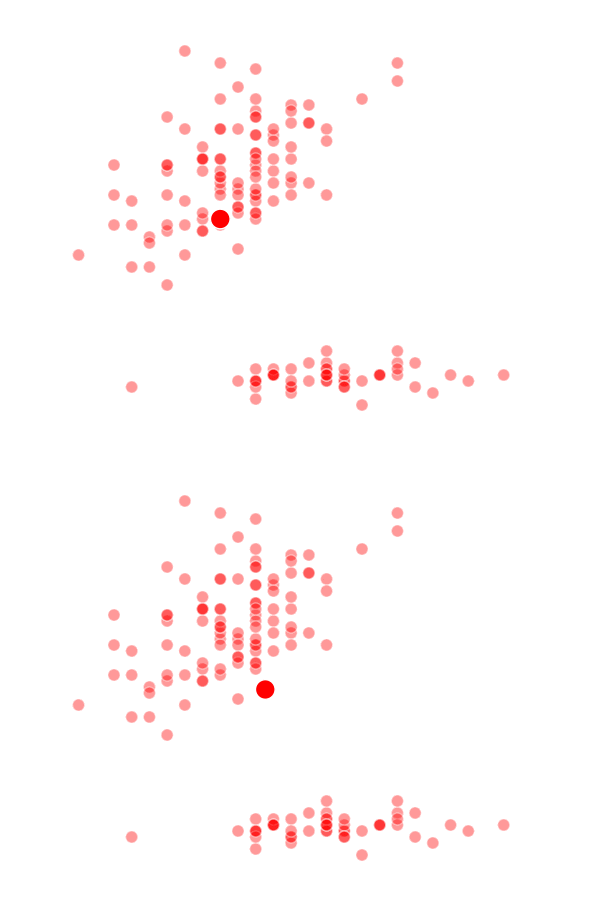
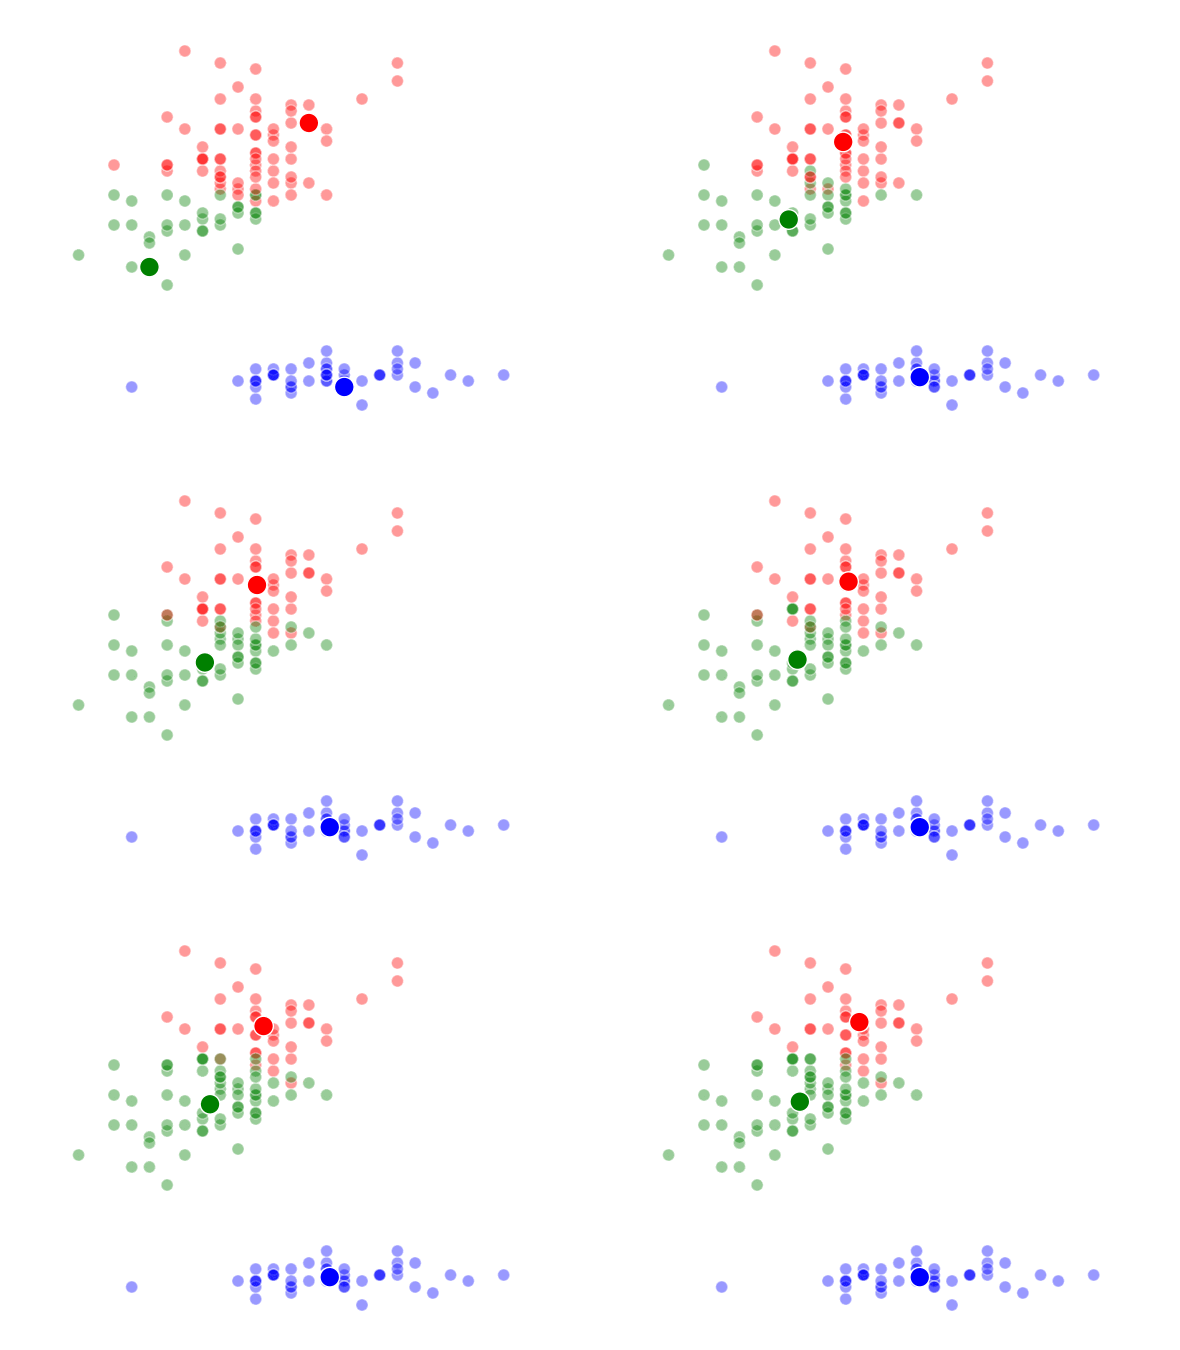
The way K-Means works is you take some set of data and tell the algorithm how many clusters (K) you think might be present. This can be done systematically or explicitly. The computer will then randomly place those K-cluster centers in the data and iteratively try to optimize the classification of the real data until you have the best optimized clusters possible. Optimization, in this case, refers to minimizing the euclidean distance between classified data points and their respective cluster centers as best as possible. Below, I’ve shown the results of K-Means clustering on the famous “Iris” data using K-values from 1 - 4. By eye, we can see that there is most probably 2 or 3 clusters present (humans are very good at pattern recognition) but we can tell the computer any number of clusters we want until the number of clusters is equal to the number of data points, at which point you will have classified each datapoint as it’s own class which is fairly useless.
K = 1 Clusters
K = 2 Clusters
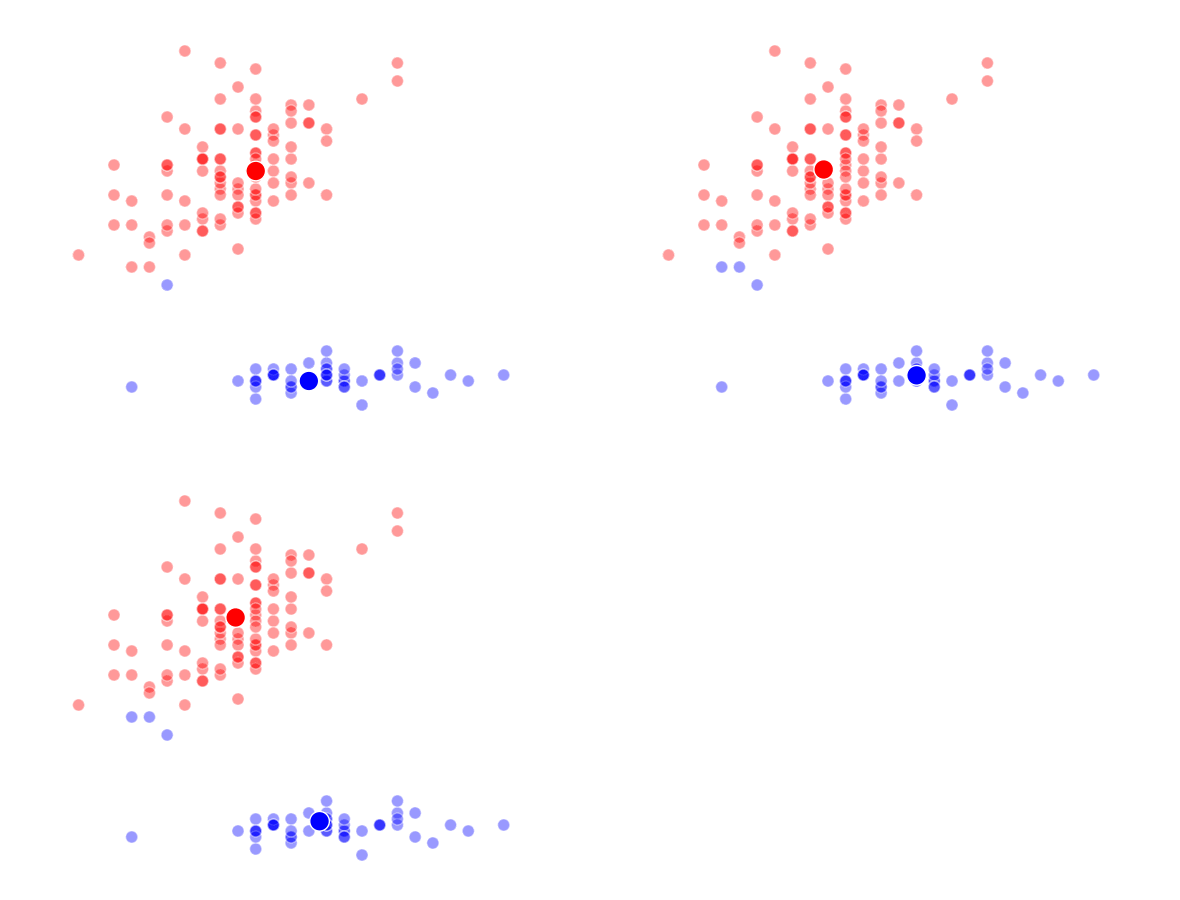
K = 3 Clusters
–
K = 4 Clusters
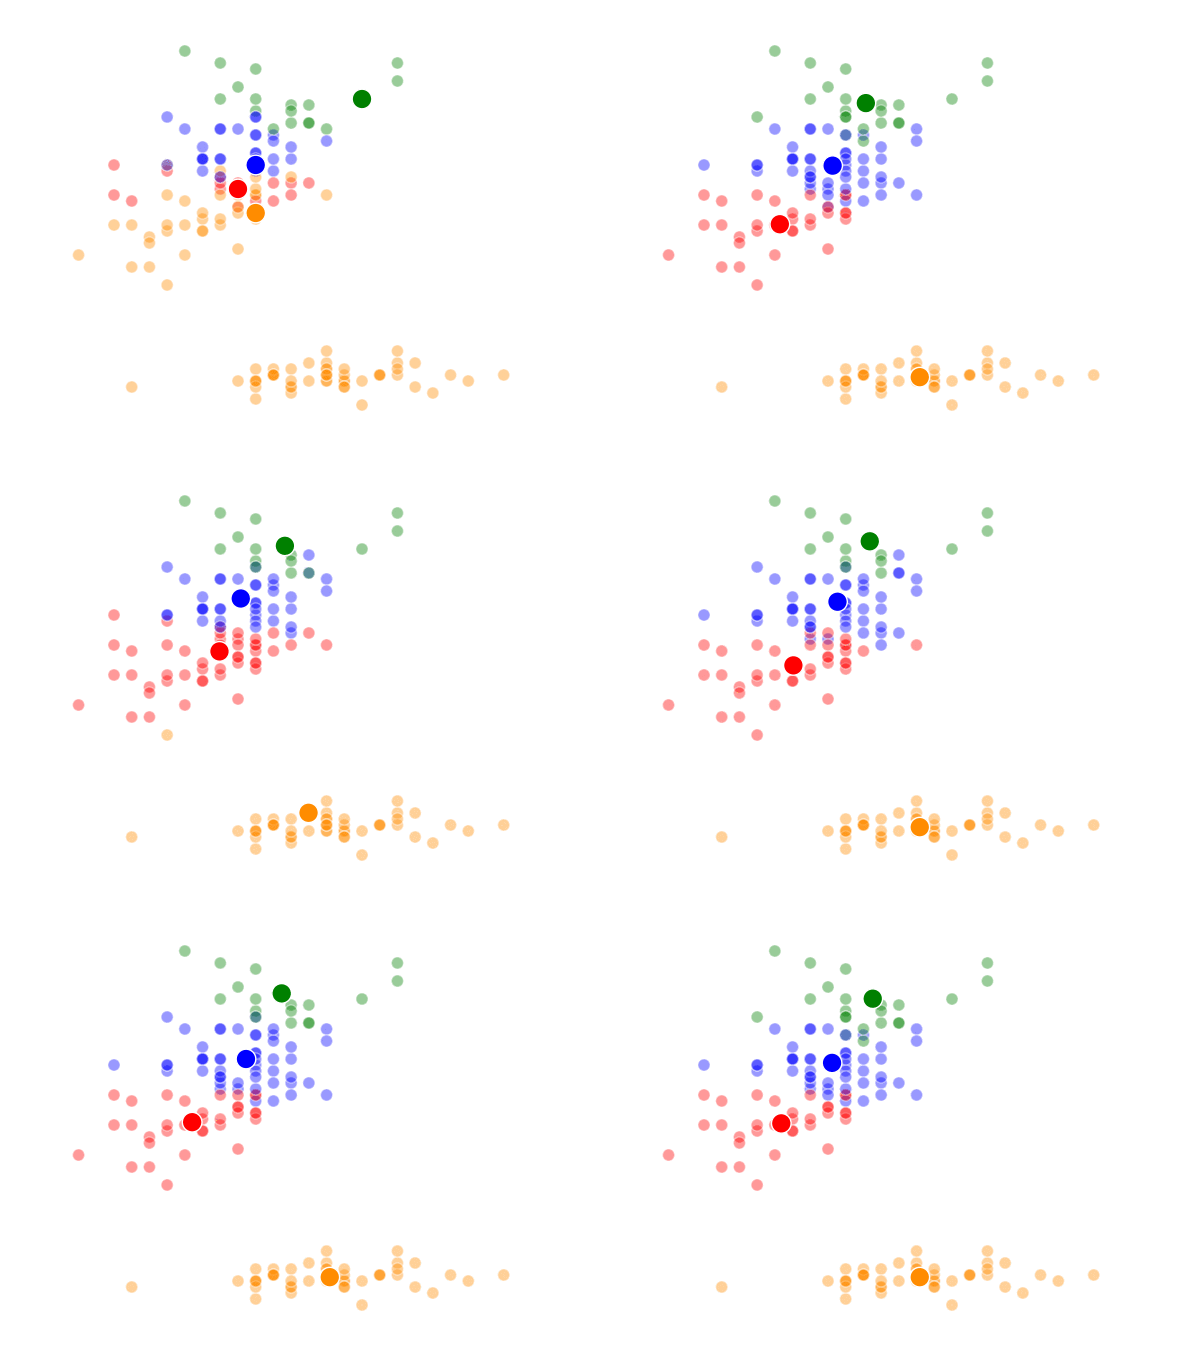
This was a pretty fun little exercise, and I enjoyed building the different visualizations using both python’s matplotlib and an fantastic command-line tool called ImageMagick (thank you Denis) to make the animations. I’ve made the class file and documentation for my code available on github if anyone is interested.
Matrices and Recommendation Systems
Apart from unsupervised methods, we again went back to linear algebra to learn a number of matrix factorization and dimensionality reduction techniques. The gist of these methods is that we can use matrix math to discover latent features in data, or to fill in unknown values with good estimates. Ever wonder how Netflix or Spotify recommends items to you? Matrix factorization is what it boils down to. Here’s an great and very accessible article on the topic from the Atlantic: How Netflix Reverse Engineered Hollywood.
Case Study: For this week’s case study, we built a joke recommender using the Jester Dataset. This is a dataset of 150 jokes with about 1.7 million ratings from 60,000 users. Our task was to best estimate the jokes that new users would score highly. My team used a GridSearch to cycle through a number of different parameters to best optimize our recommender system.
Next Week: Big Data Tools
[
galvanize
nlp
time-series
web-scraping
data-science
]
28 Jun 2016
Who comes up with these names???
This week we touched on all sorts of topics. We started off studying data science for business, looking at how to translate different models into profit curves. We then moved onto web scraping (yes, that is the proper terminology). This is one of my favorite parts of data science. Using just a few lines of code, you are able to grab information, automatically from the internet and store them for further use. We used the Beautiful Soup library to scrape thousands of New York Times articles into a MongoDB database. The web scraping part is awesome, I found the MongoDB database pretty confusing, mostly because it’s written in Javascript which is a language I have very little experience with.
Natural Language Processing
After extracting all this text data, we naturally had to come up with ways of doing text analysis; a field called ‘Natural Language Processing (NLP)’. Like everyday, the instructors at Galvanize smashed an insane amount of material into one day. I’m still trying to process it all but basically it boils down to NLP is a difficult field since words in different arrangements or with different punctuation can have different meanings and connotations.
Let's eat Grandma. Let's eat, Grandma.
There are operations you can do to make NLP more successful, dropping suffixes and word simplification (i.e. car, cars, car’s, cars’  car) is one example. But it is still a developing field with lots of progress to be made. For our assignment, we were asked to analyze how similar various articles from the New York Times were from each other.
Time Series
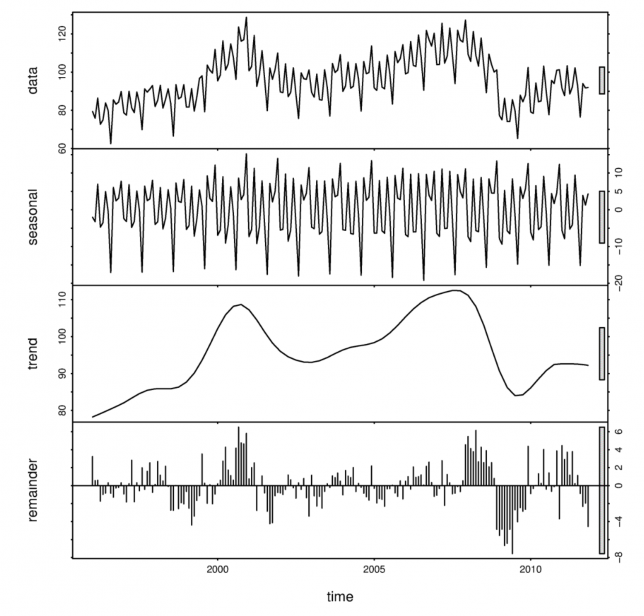 Example of time series data (top) broken down into ‘seasonal’, ‘trend’, and ‘white noise’ components.
Finally, we studied Time Series. I’ll admit that by this point in the week I was pretty much mentally checked out. I liked Time Series though, it was all about decomposing your signal into multiple ‘subsignals’. For example, let’s take temperature. At the scale of a day, the temperature goes up and down with the sun. At the scale of a year, the temperature goes up during summer and down in the winter. And if we were to look at the even larger, multi-year scale, we’d see an overall up-trend, because … global warming. If you have a good model, you should be able to capture the trends and the different cyclical components, leaving behind only white noise. In practice, this is quite difficult.
On the final day of the week we did a day-long analysis using data from a ride-sharing company (think uber or lyft). Using real data, we were able to predict customer ‘churn’ (when a customer leaves a company) and make recommendations for how to retain and build a customer base. My team built a Logistic regression model and Random Forest to capture and analyze these data.
The week ended with a much needed happy hour.
Thanks for hanging in there with me.
Next up: Unsupervised Learning + Capstone Ideas
[
galvanize
machine-learning
random-forests
supervised-methods
data-science
]
20 Jun 2016
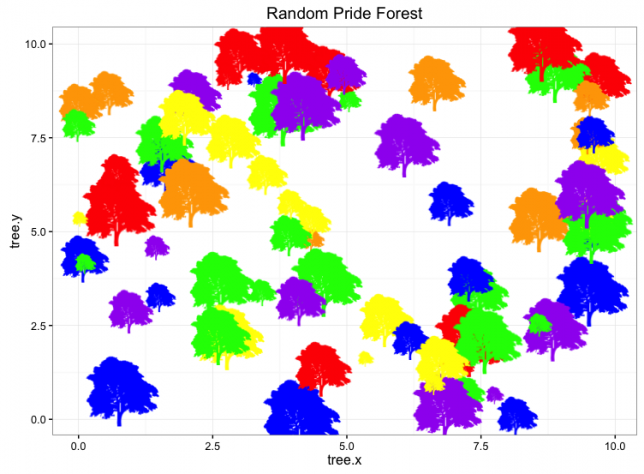 It’s Pride and here is my Random Forest - this isn’t really how it works…
This week we started on what I would consider the more exciting part of data science – machine learning.
By using computers, we are able to process vast quantities of data and discover patterns that would otherwise go unnoticed. Broadly speaking, there are two main categories of machine learning, supervised and unsupervised methods. This week we focused on supervised methods which I will briefly go over here.
Let’s take an entirely made up (and ridiculous) set of data relating ‘eye color’ and ‘sushi preference’ to whether or not a person ‘likes cats’. The ‘likes cats’ will serve as our ‘label’. Using a supervised method you feed the computer a bunch of observations as well as labels for those observations. We can then employ a variety of different algorithms to determine what, if any, features relate to the response variable, ‘Likes Cats.’ By crafting our experimental design and analysis well, we might even be able to determine if some of those features (i.e. eye color), CAUSE someone to like cats. More than that, if our model is good, we take a new person’s eye color and sushi preference, and predict if they’ll like cats or not with some degree of certainty (think targeted ads).
| X1 = Eye Color |
X2 = Favorite Sushi |
Y = Likes Cats |
| Brown |
California Rolls |
True |
| Brown |
Yellowtail |
False |
| Blue |
California Roll |
False |
| Green |
Cucumber Roll |
True |
Now, from my example, this may seem childish and pointless but imagine you have thousands of predictors variables (X’s) and millions of observations (rows of data). How do you process this? How do you find patterns? Certainly not using an Excel spreadsheet.
This is the type of challenge that biostatisticians are facing when using genetic data to predict cancers and Facebook’s engineers deal with when trying to recognize classify users by their behaviors. These are non-trivial problems to have and machine learning is an essential tool for solving them.
Click here for a beautiful example of machine learning at work!
We learned 8 different algorithms this week. It was definitely an intense week and I won’t bore you by going over all of the nitty gritty. I will however provide links to helpful resources if you are at all interested. Gradient Descent, Stochastic Gradient Descent, Decision Trees, Random Forests, Bagging, Boosting, AdaBoost, and Support Vector Machines.
Please keep reading and ask me about Machine Learning, it’s awesome.
[
galvanize
Regression
data-science
]
13 Jun 2016
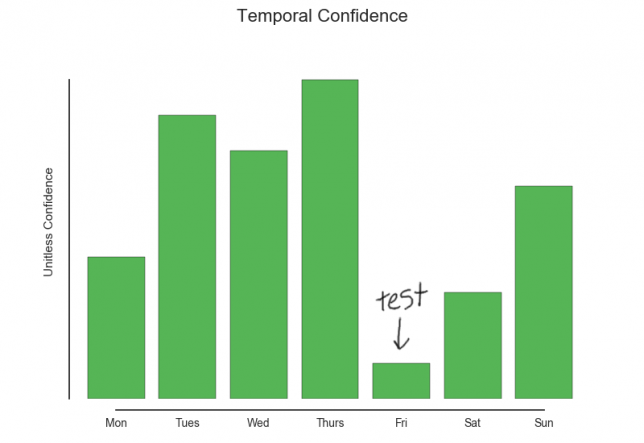 My general confidence this week.
This week we studied various methods of linear and logistic regression. We went pretty deep into the mathematical underpinnings for why these techniques work, much further than I had gone in undergraduate statistics or graduate school work. The way we studied these regression techniques was to build our own models from scratch and compare their performance and outputs with that of Python’s own built-in libraries: statsmodels and scikit-learn. I am definitely not a fan of the documentation for either or these modules (there is NO reason that technical writing need be inaccessible) but scikit-learn at least seems slightly more intuitive. Both programming libraries are however very powerful and I was impressed with the speed with which they both were able to fit complex models on our datasets.
Being able to build a model to represent data is of no use to anyone unless you are able to interpret what the model actually means and how statistically significant it’s results are. We therefore spent a good deal of time this week learning various ways verify a model’s validity. This is something I spent a good deal of time doing during my year’s of experimental work in labs so I felt pretty good working through these assignments.
Dying computer…
What made this week particularly hard was my < 4 year old computer decided it would be a great time to die. It did this right in the middle of a quiz. The screen flashed shades of green and blue, it went totally black and then I heard a series of beeps coming from the inside the computer (rather than the speakers). Some sleuthing seemed to indicate that the RAM could potentially be bad. I purchased new RAM and a new solid-state drive on Amazon. Wednesday, after a long day at Galvanize, I spent the entire evening (until roughly 2am) installing the new parts and installing all software I needed.
Seemed like everything was running smoothy during the morning, but alas, even with the new parts, the computer continued to crash. So…I am now writing to you from a brand-new macbook. I have 14 days to see if I can fix my old one and return this new one, otherwise I’ll be keeping my new computer. It is a good 5 pounds lighter than my previous, so that’s nice.
La fin du semaine
The week ended with a difficult assessment covering math, statistics, python, pandas, numpy, SQL and more. My sister flew in Friday evening and we have been enjoying a weekend of hiking, celebrating my cousin’s PhD and eating far too much food.
Next Week: The real meat of the course begins – Machine Learning.


 car) is one example. But it is still a developing field with lots of progress to be made. For our assignment, we were asked to analyze how similar various articles from the New York Times were from each other.
 Example of time series data (top) broken down into ‘seasonal’, ‘trend’, and ‘white noise’ components.
 It’s Pride and here is my Random Forest - this isn’t really how it works…
 My general confidence this week.